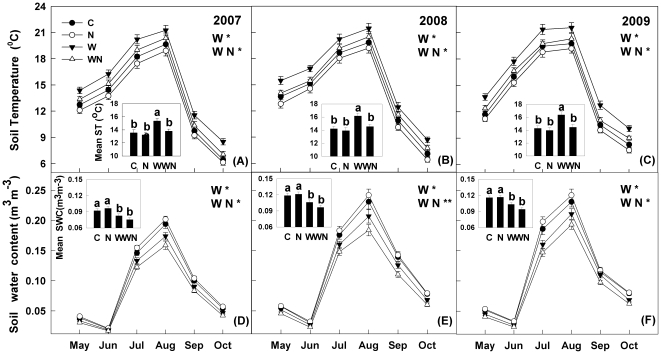
Figure 1. Seasonal variations of soil temperature (ST) and soil water content (SWC) at 15 cm depth in response to warming (1.8°C) and N addition (10 g m−2 yr−1) in the temperate grassland of northeastern China.
Values show the means of ST and SWC from May to October in three years. The small pictures show the seasonal mean ST and SWC values of the three growing seasons under the four treatments. Vertical bars indicate standard errors of means (n = 6). Difference lowercase letters indicate statistically significant differences (P<0.05). C = control, N = N addition, W = warming, WN = combined warming and N addition. *, ** represent significant at P<0.05 and P<0.01.

