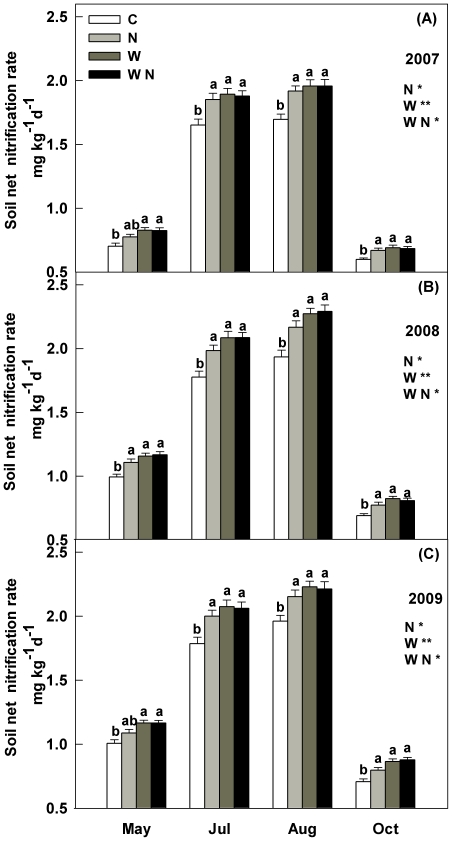
Figure 4. Seasonal responses of soil net N nitrification rate (NNR) at 15 cm depth to warming (1.8°C) and N addition (10 g m−2 yr−1) in temperate grassland of northeastern China.
Values show the monthly means of soil NNR from May to October during the three growing seasons. Vertical bars indicate standard errors of means (n = 6). Difference lowercase letters indicate statistically significant differences (P<0.05). *, ** represent significant at P<0.05 and P<0.01. See Figure 1 for abbreviations.

