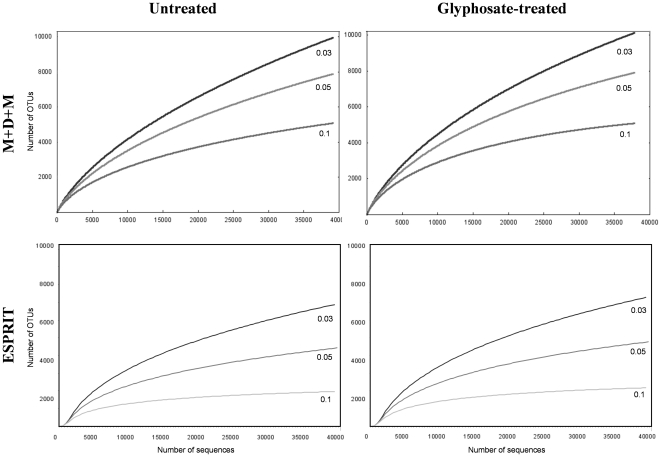
Figure 2. Rarefaction analysis.
Rarefaction curves of representative samples taken in the first year at the final sampling time of glyphosate-treated and untreated soils from field 2 determined by using the MUSCLE, DNADIST and Mothur (M+D+M) combination or the ESPRIT program, are shown for OTUs with dissimilarities do not exceeding 3%, 5% or 10%. Rarefaction curves for the other samples showed a similar pattern.

