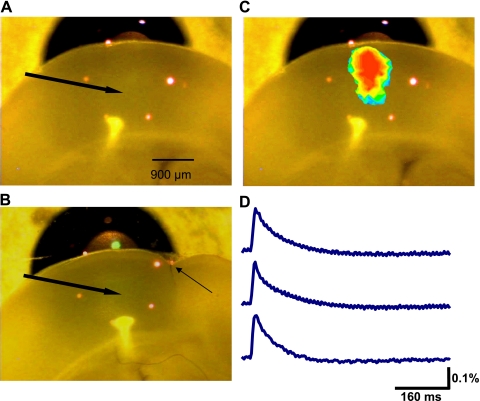
Fig. 6.
Voltage-sensitive dye imaging of evoked activity. A: photograph showing the typical position of the brain slice over the diode array. The red dots indicate the borders of the hexagonal photodiode array. The array was positioned so that the upper limit was approximately in line with the pial surface. The arrow indicates the approximate position of the stimulating electrode. B: similar picture showing the typical position of the array relative to the freeze lesion. Small arrow indicates location of lesion. C: a pseudocolored image of peak activity is shown superimposed on the image of a slice. D: typical responses from selected individual diodes showing time course of fluorescence change.

