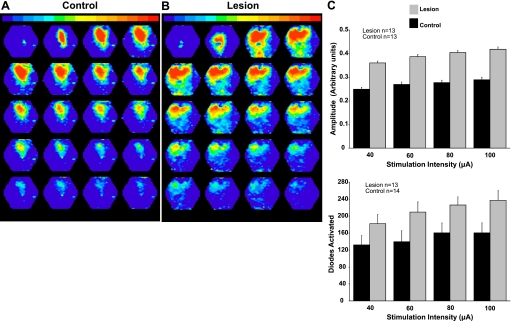
Fig. 7.
Comparison of voltage-sensitive dye signals in control and lesioned animals. A: specimen record of a typical network response evoked from control cortex. B: a typical network response evoked in the hyperexcitable region adjacent to the freeze lesion. Evoked activity near the malformation in freeze-lesioned rats spreads further and is of higher amplitude. C: summary diagrams showing differences in response amplitude (top) and number of diodes activated (bottom) in lesioned vs. control animals.

