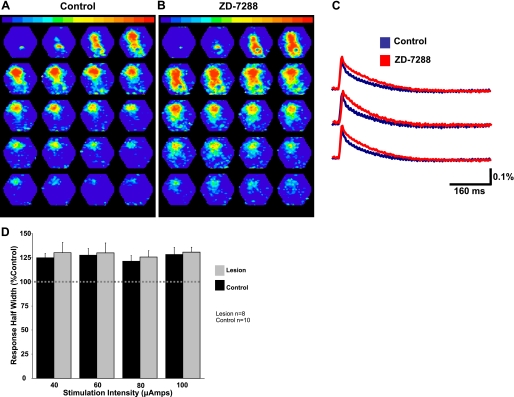
Fig. 8.
HCN channel inhibition increases the duration of evoked network activity. A: typical network response evoked before HCN channel inhibition in a control animal. B: the same response after HCN channel inhibition with 10 μM ZD7288. C: responses from individual diodes before (blue) and after (red) HCN channel inhibition are shown superimposed. HCN channel inhibition increased the half-width of these responses. D: bar graphs showing that Ih inhibition increases the duration of evoked activity in both control and lesioned animals.

