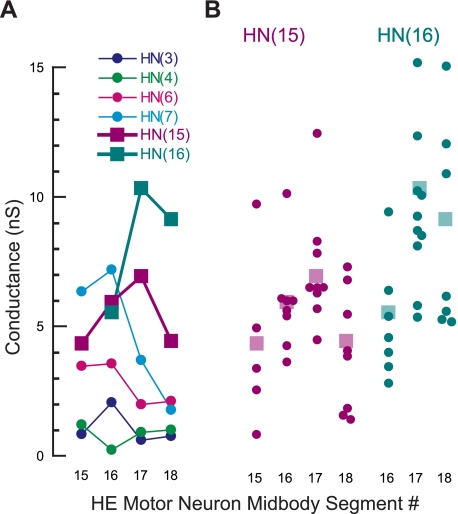
Fig. 6.
Synaptic weight (expressed as conductance; see text for details) of all the premotor HN interneurons connected to the rear HE motor neurons in midbody segments 15 to 18. Data for the front and middle heart premotor interneurons are from Norris et al. (2007a). Standard colors are used for the HN interneurons (see methods). A: on average, synaptic weight from the front premotor HN(3) and HN(4) interneurons was weak in all 4 HE motor neurons. When the synaptic strength profiles of the HE(15) and HE(16) are compared with those of the HE(17) and HE(18) motor neurons, synaptic strengths from the middle premotor HN(6) and HN(7) interneurons fall off sharply, whereas the strengths of the rear premotor HN(15) and HN(16) interneurons increase in the HE(17) and (18) motor neurons. SD are omitted for clarity. B: synaptic weight varies in individual heart motor neurons. Each dot represents the spike-triggered average of 1 connection tested. The transparent squares are the means shown in A.

