Fig. 9.
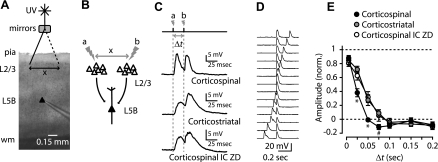
Ih narrows the coincidence detection time window for EPSPs from 2 spatially distributed sets of layer 2/3 pyramidal neurons. A: bright-field (4×) image of slice recording configuration (scale bar, 0.15 mm) depicting UV stimulation [time lag (Δt)] of EPSPs from 2 different layer 2/3 sites separated by ∼0.5 mm. B: schematic depicting stimulation protocol. C: traces show responses of a corticospinal neuron, corticostriatal neuron, and corticospinal neuron recorded with intracellular ZD7288 to stimulation of 2 sites (a and b) with an interstimulus interval (ISI; Δt) of 50 ms (20 Hz). D: example of a family of responses for the stimulation paradigm, recorded from a corticospinal neuron. E: mean (±SE) amplitude of peak responses vs. Δt, normalized to maximum depolarization and to minimum depolarization (*P < 0.05; #significance between corticospinal and corticostriatal).

