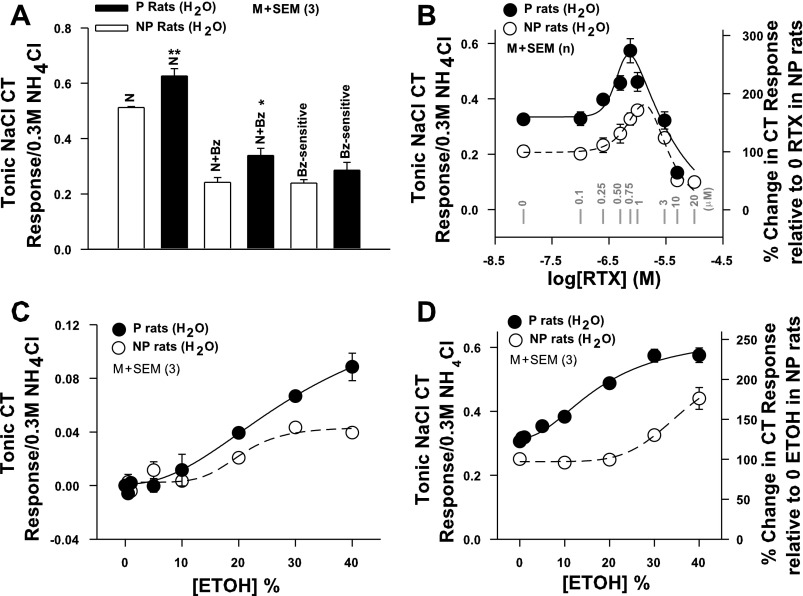
Fig. 4.
NaCl CT responses in P and NP rats. A: summary of the magnitudes of the tonic CT responses to NaCl (N) and N+Bz and the Bz-sensitive component of the CT response in P and NP rats maintained on H2O (group 2; Fig. 1). In each case the CT responses were normalized to the corresponding tonic CT responses obtained with 0.3 M NH4Cl and presented as tonic NaCl CT response/0.3 M NH4Cl. Each bar represents mean ± SE value of the normalized tonic CT response from 3 animals. *P = 0.0355, **P = 0.0133 (unpaired). B: CT responses were measured while the tongue was stimulated with rinse solution (R) and then with N+Bz+resiniferatoxin (RTX) (0–10 × 10−6 M) in P (●) and NP (○) rats maintained on H2O (group 2; Fig. 1). In each animal the tonic CT response was normalized to the corresponding tonic CT responses obtained with 0.3 M NH4Cl. In NP rats each point represents mean ± SE value of normalized tonic CT response from 4–9 animals (n) and is plotted as a function of log RTX concentration. In P rats each point represents mean ± SE value of normalized tonic CT response from 3 animals (n) and plotted as a function of log RTX concentration. The zero RTX concentration is shown as −8.0 on the x-axis. Gray vertical bars represent points at RTX concentration (in μM). Right y-axis represents % change in CT response relative to the response at 0 RTX in NP rats. Significant differences were found for RTX concentration (P = 0.04 for both, 2-way ANOVA) and magnitude of the RTX response in P and NP rats (P = 0.008, Bonferroni corrected), with no significant interaction between effects of strain and concentration. In the rinse solution RTX did not increase the CT response above baseline (data not shown). C: CT responses were measured while the tongue was first stimulated with rinse solution R and then with R+ETOH (0–40%) in P (●) and NP (○) rats (group 2; Fig. 1). In each case tonic CT responses were normalized to corresponding tonic CT responses obtained with 0.3 M NH4Cl. Each point represents mean ± SE value of normalized tonic CT response from 3 animals (n) and is plotted as a function of % ETOH concentration. No significant differences were found for ETOH concentration (P > 0.05 for both, 2-way ANOVA, Bonferroni corrected) and magnitude of the ETOH response in P and NP rats (P > 0.05), with no significant interaction between effects of strain and concentration. D: CT responses were measured while the tongue was first stimulated with rinse solution R+ETOH (0–40%) and then with N+Bz+ETOH (0–40%) in P (●) and NP (○) rats (group 2; Fig. 1). In each case tonic CT responses were normalized to corresponding tonic CT responses obtained with 0.3 M NH4Cl. To calculate the magnitude of the N+Bz CT response in the presence of ETOH, the response of ETOH in the rinse was subtracted from the total N+Bz+ETOH response. Each point represents mean ± SE value of normalized tonic CT response from 3 animals and is plotted as a function of % ETOH concentration. Right y-axis represents % change in CT response relative to 0 ETOH in NP rats. Significant differences were found for ETOH concentration (P = 0.027 for both, 2-way ANOVA) and magnitude of the ETOH response in P and NP rats (P = 0.009, Bonferroni corrected), with no significant interaction between effects of strain and concentration.

