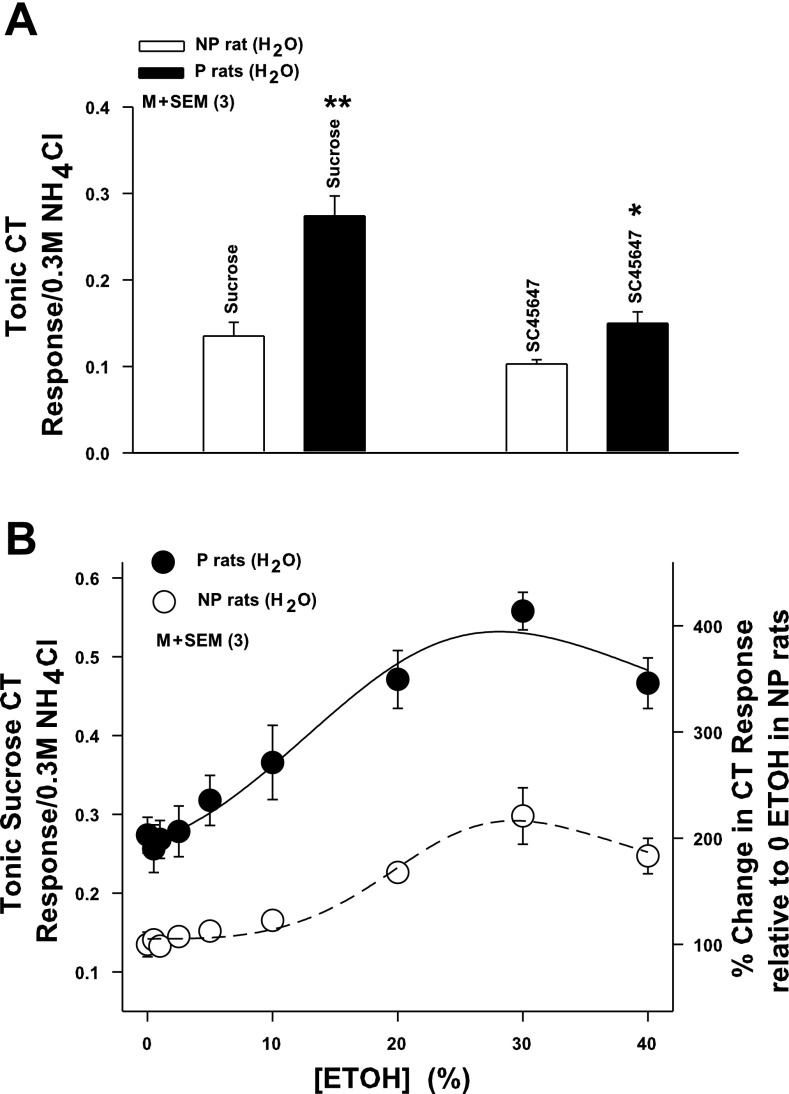
Fig. 6.
CT responses to sweet taste stimuli in P and NP rats. A: CT responses were monitored while P and NP rat tongues (group 2; Fig. 1) were first stimulated with rinse solution R and then with 0.5 M sucrose or 0.0008 M SC45647. In each case CT responses were normalized to corresponding CT responses obtained with 0.3 M NH4Cl. Each bar represents mean ± SE value of normalized tonic CT response from 3 animals. *P = 0.0289, **P = 0.0013 (unpaired). B: CT responses were measured while the tongue was first stimulated with rinse solution R and then with R+0.5 M sucrose in the absence and presence of ETOH (0–40%) in P (●) and NP (○) rats (group 2; Fig. 1). To calculate the magnitude of the CT response to sucrose in the presence of ETOH, the response of ETOH in the rinse was subtracted from the total ETOH+sucrose response. In each case tonic CT responses were normalized to corresponding tonic CT responses obtained with 0.3 M NH4Cl. Each point represents mean ± SE value of the normalized sucrose tonic CT response from 3 animals plotted as a function of % ETOH concentration. Right y-axis represents % change in CT response relative to 0 ETOH in NP rats. Significant differences were found for ETOH concentration (P = 0.014 for both, 2-way ANOVA) and magnitude of the ethanol+sucrose response in P and NP rats (P = 0.0006, Bonferroni corrected), with no significant interaction between effects of strain and concentration.

