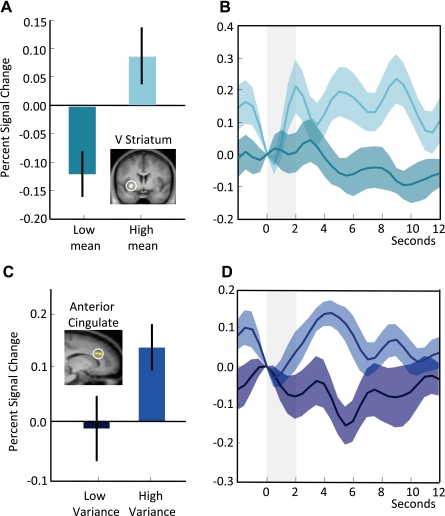
Fig. 5.
Neural activity corresponding to mean and variance. A: ventral (V) striatum showed an increased response during the presentation of stimuli that predicted high-mean reward distributions (peak at −24, 5, −5; P < 0.05, small volume corrected for ventral striatum). B: time course of ventral striatum response to high- (light blue) and low- (dark blue) mean predicting stimuli. C: anterior cingulate showed increased BOLD response during the presentation of stimuli that predicted high-variance rewards (peak at 15, 23, 28; P < 0.05, small volume corrected for 5-mm sphere around peak coordinates for variance reported in Christopoulos et al. 2009). D: time course of anterior cingulate response to high- (light blue) and low- (dark blue) variance predicting stimuli.

