Fig. 3.
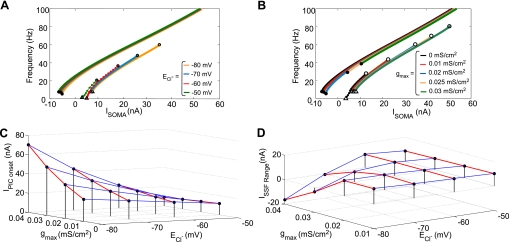
Effect of changes in inhibitory synaptic conductance (gmax) and chloride reversal potential (ECl−) on PIC activation and SSF. A and B: steady-state I-f curves with respect to changes in ECl− and maximal strength of gmax, respectively. Irecruitment, IPIC-onset, and IPIC-offset are denoted by white triangles, white circles, and black circles, respectively. In A, gmax is set to a default value of 0.02 mS/cm2 while ECl− is varied as indicated; in B, ECl− is set to a default value of −80 mV while gmax is varied as indicated. C: PIC onset threshold IPIC-onset for different values of ECl− and gmax. Each red line is an iso-ECl− line. Note that increasing gmax increases IPIC-onset with larger effects at lower ECl− values; at ECl− = −50 mV, however, there is a nominal decrease in IPIC-onset with increasing gmax. D: range of injected current values for which SSF exists for various combinations of gmax and ECl−, where ISSF range = Irecruitment − IPIC-offset. Each red line is an iso-ECl− line. Gray surface indicates the boundary above which SSF exists. Increasing the strength of inhibition eliminated SSF at ECl− values of −80 and −70 mV; at further depolarized ECl−, the ISSF range was nominally reduced as the strength of inhibition increased.

