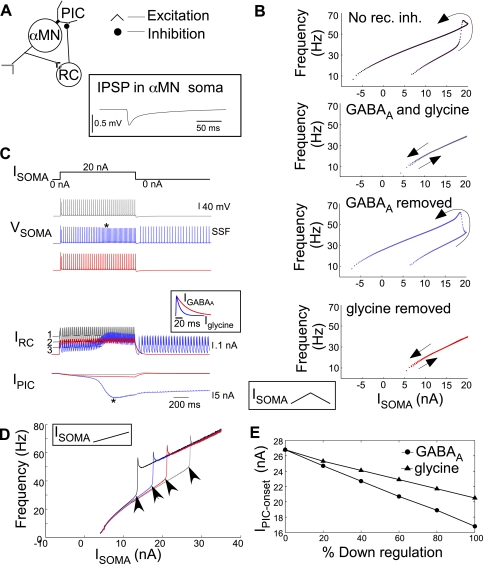
Fig. 5.
Differential effect of GABAA and glycinergic currents on PIC onset and I-f hysteresis. A: schematic of the self-inhibitory α-MN-RC network where RC activity varies in proportion to α-MN activity as normally expected. Inset shows an inhibitory postsynaptic potential (IPSP) in the motoneuron due to a single RC spike. B: α-MN I-f responses during triangular ramp Isoma. Top to bottom: counterclockwise hysteresis marking PIC activation under default condition with no RC inhibition; RC inhibition with both GABAA and glycinergic currents suppressed hysteresis, resulting in a linear I-f response; removal of GABAA currents uncovered I-f hysteresis; and removal of glycine did not result in I-f hysteresis. No rec. inh., no recurrent inhibition. C: responses to pulse Isoma (20 nA) under 3 simulated conditions of ongoing recurrent inhibition by both GABAA and glycine RC currents (gray traces), with GABAA currents removed (blue traces), and with glycinergic currents removed (red traces). Asterisk on IPIC and Vsoma marks PIC activation resulting in SSF in the absence of GABAergic inhibition. Dashed lines 1, 2, and 3 show average IRC for the respective cases; inset shows the relative kinetics of GABAA (IGABAA) and glycine currents (Iglycine). D: I-f responses to increasing ramp Isoma up to 35 nA under the 4 different conditions in B shows the different IPIC-onset (arrowheads) in the respective cases. E: changes in IPIC-onset plotted against percent selective downregulation of recurrent GABAA and glycine currents.

