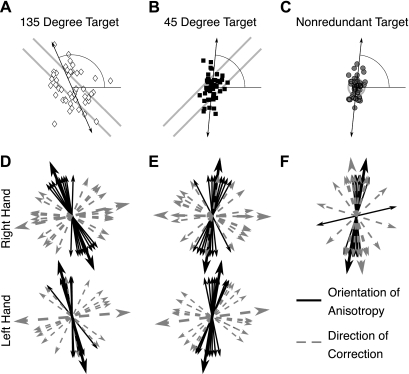
Fig. 2.
Endpoint distributions during the baseline block. A–C: data for a representative subject reaching toward the 135-degree target (A), the 45-degree target (B), and the nonredundant control target (C). Light gray lines represent the target regions. Horizontal lines indicate the horizontal axis, and oblique lines indicate the principle component regression for the observed distributions. D–F: summary data for the anisotropy analysis. Black solid lines represent the principle components of the endpoint distributions. Gray dashed lines represent the direction along which the most trial-by-trial correction was observed based on a lag-1 autocorrelation. Short lines represent individual subjects, whereas the longer line represents the group average. Data from the right hand are shown at top and from the left hand at bottom for the 135-degree target for both hands (D), the 45-degree target for both hands (E), and the nonredundant control target for the right hand only (F).

