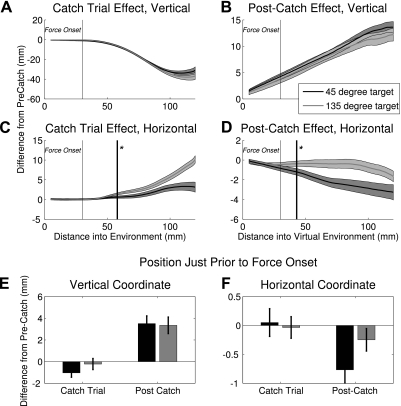
Fig. 5.
Comparison of catch and postcatch trials. A–D: average trajectories along the vertical (A and B) and horizontal axes (C and D). To standardize the data, the trajectory from the precatch trial was subtracted from each catch and postcatch movement. Negative numbers for the horizontal component indicate a leftward change from the precatch trial. Arm position recorded 30 mm into the reach demonstrated strategic changes following a catch trial for the vertical coordinate (E) and a target dependency for the horizontal coordinate (F).

