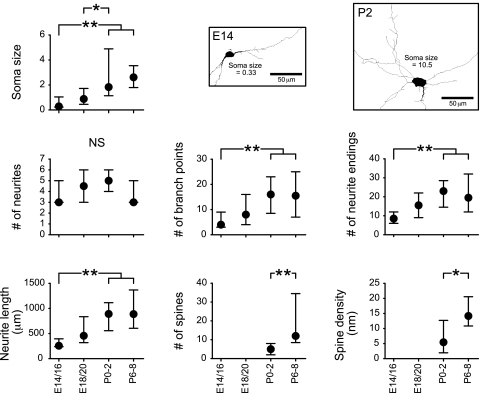
Fig. 2.
Morphometric analysis of pre- and postnatal neurons in rostral nucleus of the ST (rNST). Developmental increases in all measures are observed, except number of neurites. Spines were not observed in embryonic stages. Neuronal tracings of E14 and postnatal day 2 (P2) rNST neurons are shown in middle and top right panels. Values are medians within the 25th–75th percentile range. Horizontal bars above each graph indicate pairs with significant differences; *P < 0.01 and **P < 0.05, Mann-Whitney test. NS, not significant.

