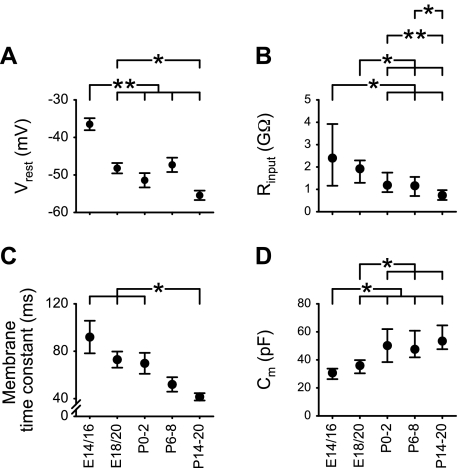
Fig. 3.
Developmental changes in passive membrane properties. A: resting membrane potential (Vrest). B: input resistance (Rinput). C: membrane time constant. D: membrane capacitance (Cm). Values of Vrest and membrane time constant are means ± SE, and values of Rinput and Cm are medians within the 25th–75th percentile range. Statistical differences in Vrest and membrane time constant between groups were tested using Scheffe and Games-Howell tests, respectively. Statistical differences in Rinput and Cm between groups were tested using Mann-Whitney tests. Horizontal bars above each graph indicate pairs with significant differences; *P < 0.01 and **P < 0.05.

