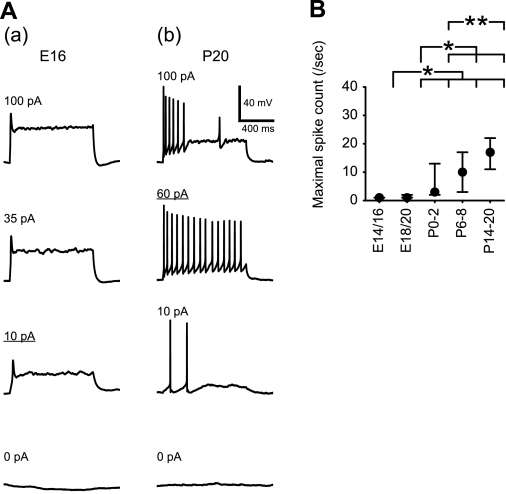
Fig. 6.
AP discharge in response to tonic membrane depolarization. A: AP spikes evoked by depolarizing current steps (1-s duration) in neurons at E16 (a) and P20 (b). The current intensities are indicated in the top left of each trace. Depolarizing currents (10 and 60 pA) resulted in maximal spike counts in the E16 and P20 neurons, respectively. B: developmental change in maximal spike count. Values are medians within the 25th–75th percentile range. Horizontal bars above the graph indicate pairs with significant differences; *P < 0.01 and **P < 0.05, Mann-Whitney test.

