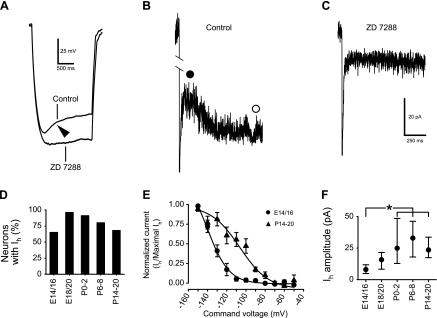
Fig. 9.
Difference between peak and steady-state Vm (voltage sag) and inward current (Ih) in an E16 neuron. A: voltage sag (arrowhead) evoked by hyperpolarizing current (30 pA) was eliminated by Ih blocker ZD 7288. B: current trace in response to hyperpolarization to −130 mV in control ACSF. Difference between filled and open circles indicates amplitude of Ih. C: current trace in response to hyperpolarization to −130 mV in the presence of ZD 7288. Ih was eliminated by ZD 7288. D: incidence of neurons with Ih at different ages. E: activation curves for Ih at E14/16 (circles) and P14–20 (triangles). F: developmental change in amplitude of Ih. Values are medians within the 25th–75th percentile range. Horizontal bars above the graph indicate pairs with significant differences; *P < 0.05, Mann-Whitney test.

