Fig. 2.
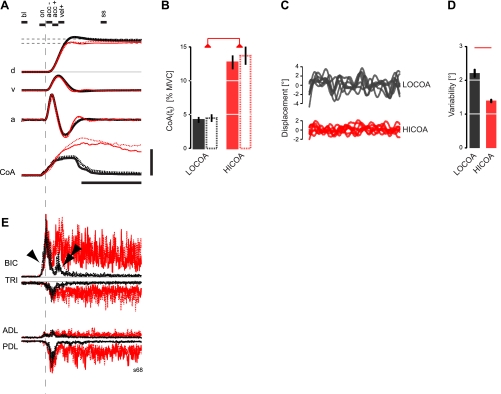
Effect of cued elbow muscle coactivation and “online” visual cursor feedback on performance variables during reaching. A, top: average kinematics of reaching movements with continuous visual feedback of the cursor (solid) or only after movement (dashed) from a single representative subject: 0% cued elbow CoA (heavy black), 10% cued CoA (red). CoA, realized elbow BIC/TRI coactivation values (see text for details). Vertical scale bar: 25°, 150°/s, 1,500°/s2, and 10% change in CoA. Horizontal scale bar: 500 ms. Horizontal dashed lines correspond to the cued target region. B: population analysis (n = 10) of average realized coactivity values at the end of reaching. Line type and color encoding as in A. Horizontal red bar highlights statistically significant differences (P < 0.05, corrected for multiple comparisons). C: kinematics during the 2.5-s elbow joint postural stabilization period after the end of reaching in perturbed training trials with 0% cued CoA (top) and 10% cued CoA (bottom) for a representative subject. Variations in elbow angle during hold periods without perturbation were typically <0.1° peak to peak. D: population analysis of elbow joint angle variability during terminal postural stabilization. E: average EMG activities (n = 10 each trace) recorded during the same movements and plotted on the same time scale as in A. Line type and color encoding are also as in A. Single arrowhead, AG1; double arrowhead, AG2. BIC, biceps brachii; TRI, triceps, lateral head; ADL, anterior deltoid; PDL, posterior deltoid. Vertical scale bar in A also corresponds to a 10% maximum voluntary contraction (MVC) change in EMG activity. Error bars indicate ±SE in all panels.

