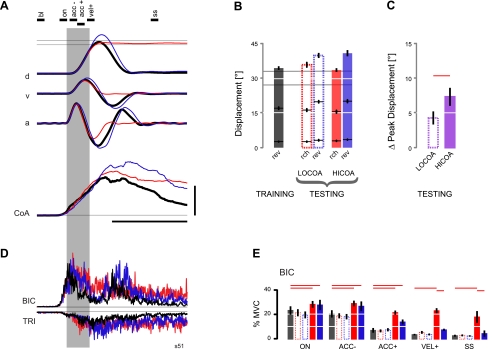
Fig. 5.
Comparisons of kinematics and EMG activities in reaches with HICOA (red), interspersed test reversals (blue), and baseline reversals (heavy black) (representative subject). A: ensemble averages (n = 10 trials). Scale bars and time indicator lines are as in Fig. 2. Black line segments above traces indicate time windows used for EMG analysis in E. B: population analysis of primary flexion amplitudes in both movement tasks during the testing block of the 0% and 10% supersets (right) and for reversals in the training blocks (left). C: change in peak displacement in reversals after reach training with 0% (LOCOA) and 10% (HICOA) CoA. D: average EMG activities recorded during the same movements as in A. Scale bars and time indicator lines are as in Fig. 2. E: population analysis of EMG activity within the sampling intervals spanning flexion movement as well as steady state. Error bars indicate ±SE in all panels.

