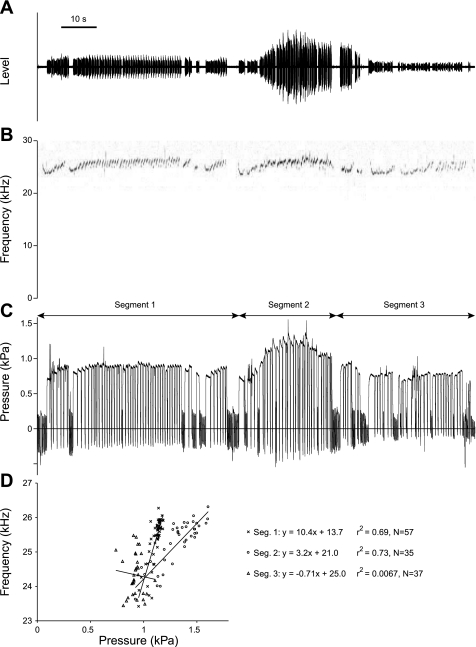
Fig. 7.
Pressure-frequency relation in a long bout of 22-kHz calls from 1 rat. The animal started to call spontaneously while the observer was in the room (segment 1). During segment 2, the animal was gently petted. During segment 3, the observer left the animal alone but was still in the room. A: oscillogram. B: spectrogram. C: subglottal pressure. D: each data point represents a call (measurement in midcall). A total of 129 calls were recorded over a period of 2 min and 15 s.

