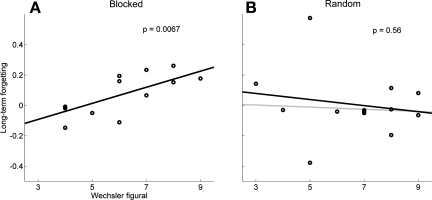
Fig. 8.
Data: forgetting in individuals poststroke in a 24-h posttraining period is shown as a function of Wechsler visual memory score (figural) following training in either blocked (A) or random schedule (B) in the individuals poststroke who participated in the study. Black lines are regression lines; the gray line in B is a robust regression line (with default weighting function in Matlab robustfit function); the robust regression line is superimposed on the regression line in A. Compare with the computer simulations of Fig. 5.

