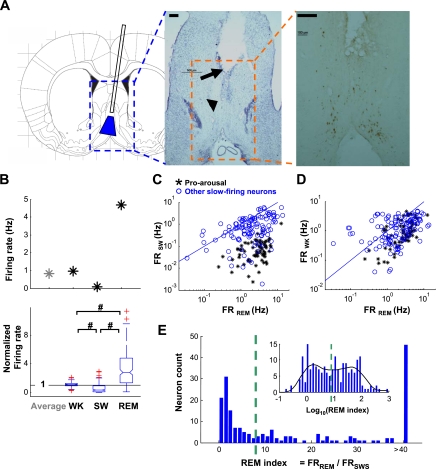
Fig. 1.
Slow-firing neurons have higher firing rate in rapid eye movement (REM) sleep. A: schematic and examples of the recording site demonstrated with histology and immunohistochemistry. Left: the cannula implant design and estimated target area (blue area) in the medial septum-vertical limb of the diagonal band of Broca (MSvDB). Blue dashed rectangle indicates the area in middle. Middle: histology (Nissl staining) image. The empty space (arrow) resulted from cannula implantation. The arrowhead indicates initial spreading of the bundled electrodes from the tip of the cannula. Electrodes advanced progressively for another 1 mm, during which time the recordings were obtained. Scale bar at top left, 200 μm. Orange dashed rectangle indicates area at right. Right: choline acetyltransferase staining demonstrating cholinergic neurons in MSvDB, dispersed in the area being recorded. Scale bar at top left, 200 μm. B: firing rates of a representative (top) and all slow-firing MSvDB neurons (bottom) change across waking (WK), slow-wave (SW), and REM sleep. Box plot (bottom) shows firing rates in different behavioral states normalized to average firing rate of each individual neuron. Horizontal line indicates 1. For each box plot, the central mark (middle of notch) is the median; box edges mark the 25th and 75th percentiles; red crosses are outliers; the whiskers extend to the most extreme data points not including outliers; and nonoverlapping notches between groups indicate a significant difference between medians (significance level = 0.05). Firing rate was highest in REM, lowest in SW, and intermediate in WK (#P < 0.001, Wilcoxon signed rank test). C and D: 2-dimensional (2-D) plots of firing rate comparison for individual neurons between REM and SW (C) and between REM and WK (D). Black symbols represent pro-arousal slow-firing neurons as defined in Fig. 4; blue symbols represent other slow-firing neurons; and blue lines indicate unity. E: histogram of REM index for individual neurons. Inset: histogram of log-transformed index values with local fitting of distribution curve (black). Green dashed line indicates local minimum used as the cutoff threshold (REM index = 8.0). Neurons were therefore grouped into REM− (92/190) and REM+ (98/190) groups. FRSW, FRREM, and FRWK, firing rate of individual neurons in SW, REM, and WK states, respectively.

