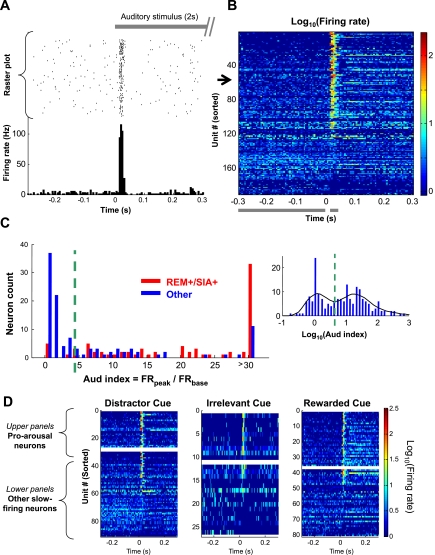
Fig. 3.
Most REM+/SIA+ neurons have transient auditory responses. A: example of a neuron with transient auditory response. Gray bar at top indicates a 2-s auditory stimulus (an 80-Hz white noise sound). Raster plot in middle shows the trial-by-trial firing of this neuron (black dot, single spike) aligned to the onset of the auditory stimuli (time 0). PSTH at bottom summarizes the response of this neuron, showing a very strong but transient response, tightly locked at 15–30 ms after the stimulus onset. B: pseudocolored PSTHs of all slow-firing MSvDB neurons, sorted according to the auditory response index (Aud index; see materials and methods). The example in A is unit 53 on this plot (black arrow). Horizontal gray bars at bottom indicate the peak (15 to 35 ms) and baseline (−300 to −5 ms) periods used to calculate Aud index. C: histogram of Aud index for 2 groups of neurons, REM+/SIA+ (red) and the remaining ones (blue). Most REM+/SIA+ neurons had a higher Aud index, whereas the majority of the remaining neurons had a low Aud index. Inset: histogram of log-transformed index values of all slow-firing neurons with local fitting of distribution curve (black). Green dashed line indicates the local minimum used as the cutoff threshold (Aud index = 4.5). Neurons were grouped as Aud− (81/190) or Aud+ (109/190). D: responses to auditory cue (white noise) not depending on the role of the cue. Pseudocolored PSTHs of all slow-firing MSvDB neurons are categorized based on the role of the white noise cue for individual animals. Horizontal white bars (middle) separate pro-arousal slow-firing neurons (top) and other slow-firing neurons (bottom). See Fig. 4 for definition of pro-arousal and other slow-firing neurons.

