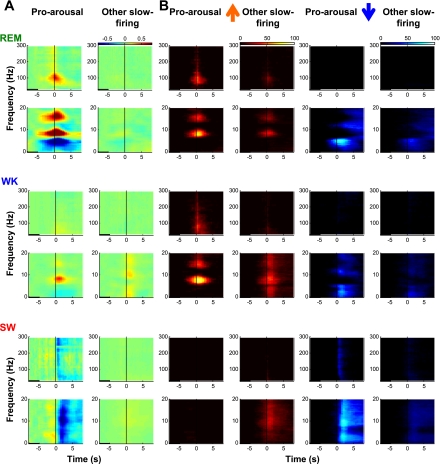
Fig. 8.
Pro-arousal slow-firing cholinergic neurons promote hippocampal activation. A: example of averaged spectrograms around spikes of a pro-arousal slow-firing and an other slow-firing neuron recorded in the same session. Low- and high-frequency ranges (0–20 and 30–300 Hz) are displayed separately. Spectrograms are aligned to the spikes of individual neurons (time 0, black vertical line in center). Black horizontal bar at bottom left indicates the baseline period. For normalization, average log power during the baseline period at each frequency was subtracted, and pseudocolors indicate the power increase or decrease. During REM and WK states, the firing of pro-arousal slow-firing neurons promoted increase of theta power (7–10 Hz and 2× harmonics), and in some neurons (this example) the power is in the high gamma range. Their firing was also associated with a decrease in power in frequency bands below 6 Hz. In SW sleep, the firing of these neurons was associated with a marked decrease of power in the low-frequency range (0–20 Hz). Firing of other slow-firing neuron did not lead to comparable spectral changes. B: significance plots for spectrograms of all pro-arousal slow-firing and other slow-firing neurons. Significance is based on Z scores calculated with baseline (see materials and methods). Heat plots indicate the percentage of neurons beyond Z-score threshold for positive (left 2 columns, warm color) and negative (right 2 columns, cool color) Z scores, corresponding to power increase and decrease, respectively. The pattern is similar to the individual example.

