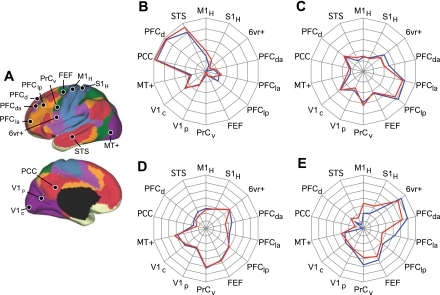
Fig. 15.
Quantitative evaluation of the specificity of cerebrocerebellar circuits involving association cortex. A: reference regions used for quantitative analysis of association cortex. PCC, posterior cingulate cortex; PFC, prefrontal cortex; STS, superior temporal sulcus. B–D: polar plots of functional connectivity strength for each of the seed regions from Fig. 14. Note that each polar plot has a distinct connectivity profile. The red lines display functional connectivity strength between the left cerebellar seed regions and right cerebral cortex seed regions, and the blue lines display the contralateral pairings. The similarity between the red and blue lines shows that the coupling profiles are reliable between the hemispheres. For B and C, the polar scale ranges from r = −0.2 (center) to r = 0.3 (outer boundary) in 0.1-step increments. For D and E, the polar scale ranges from r = −0.15 (center) to r = 0.2 (outer boundary) in 0.05-step increments.

