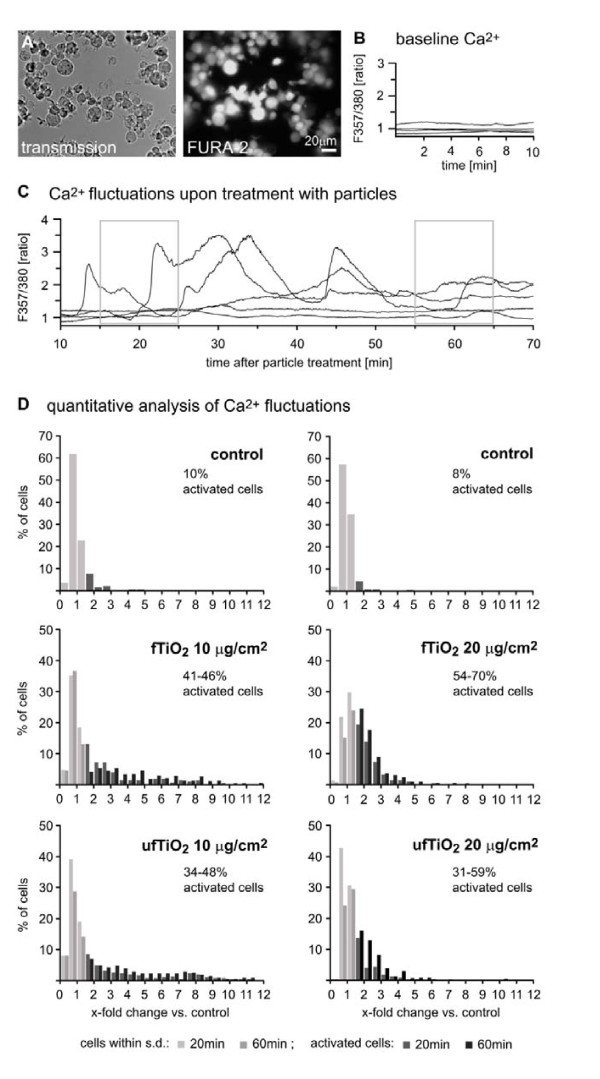
Figure 4.
Increase of [Ca2+]i after exposure of NR8383 cells to TiO2 samples. (A) Transmission image of AM (left) and image of Fura-2 fluorescence (excitation at 357 nm) (right). (B) Control experiments showing Fura-2 fluorescence ratio of untreated AM. (C) Calcium fluctuations in individual cells in response to particle application (ufTiO2 20 μg/cm2) over time. Some cells exhibit large calcium fluctuations, while others do not respond. Grey boxes indicate the time windows for which quantitative analysis shown in D was performed. (D) Quantitative analysis of calcium fluctuations: The integral of ratio traces was calculated for 10 min time windows for each individual cell. The resulting integral values were normalized to the mean of control values obtained in the absence of particles. Histograms show the percentage of cells exhibiting a 1.5 to 12 fold increase in calcium ratio integrals relative to controls. Light gray columns represent integral values within the standard deviation of controls. Dark columns represent signals of activated cells. Data are from 57 experiments on 39 coverslips, number of cells for each group: n = 198 - 443.

