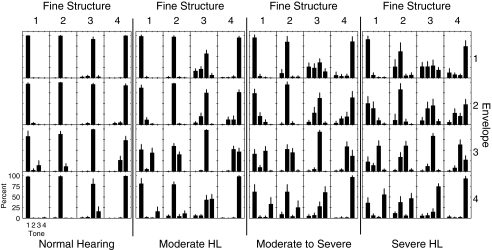
FIG. 1.
Overall means and standard deviations of the percentages of the tone recognition responses across channel conditions, both male and female voices, and all subjects in the normal-hearing group and the three subgroups of sensorineural hearing-impaired listeners. The four large panels from left to right represent the data from subjects with normal-hearing, moderate, moderate to severe, and severe hearing loss respectively. In each large panel, small panels column-wise from left to right represent the fine structure cues from tone 1 to tone 4 in the chimeric stimuli, while those row-wise from top to bottom represent the envelope cues from tone 1 to tone 4 in the stimuli. Each bar and its error bar in the bar plot represents the mean and standard deviation of the percentages of tone responses for tone 1, 2, 3, or 4.

