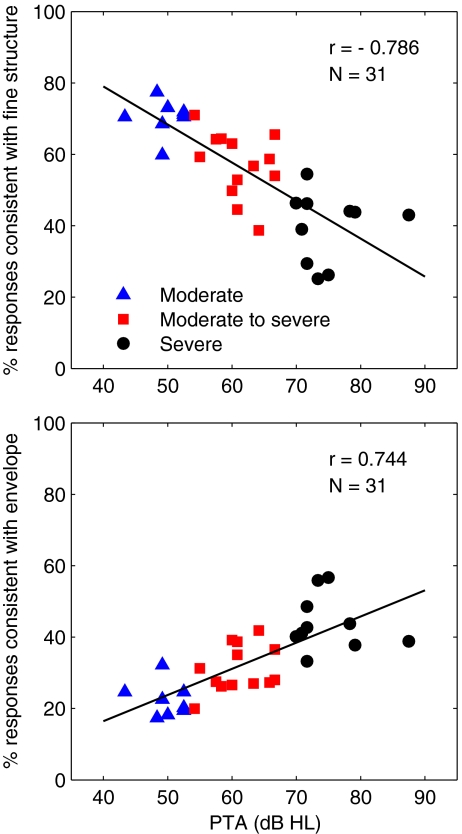
FIG. 2.
The correlation between the PTA0.5 to 2 kHz and tone recognition performance across three subgroups of hearing-impaired subjects. The different symbols represent different degrees of hearing loss as indicated in the legend. The upper panel represents the correlation between the PTA0.5 to 2 kHz and tone responses that were consistent with fine structure cues, while the lower panel represents the correlation between the PTA0.5 to 2 kHz and tone responses based on temporal envelope cues.

