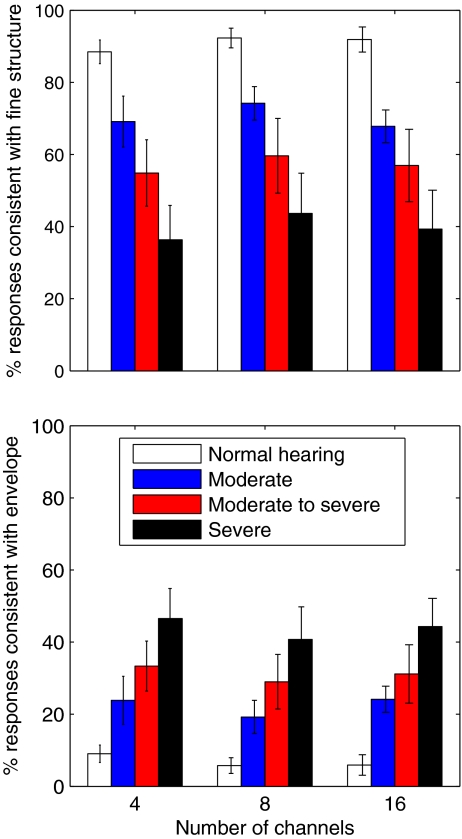
FIG. 3.
Mean percentages and standard deviations of tone recognition responses in the normal-hearing group and the three hearing-impaired subgroups using 4, 8, and 16 channels. The upper panel represents the tone responses that were consistent with fine structure of the chimeric stimuli in each group. The lower panel represents the tone responses consistent with temporal envelope of the stimuli in each group.

