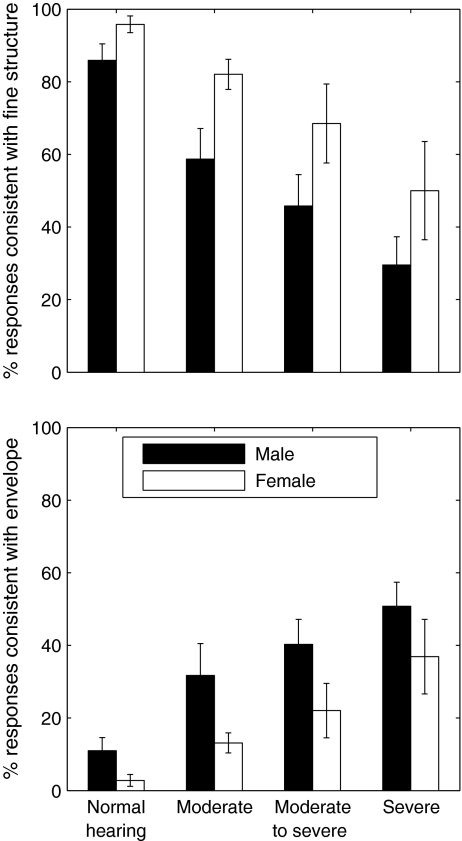
FIG. 4.
Mean and standard deviations of the percentages of tone responses consistent with fine structure (upper panel) and temporal envelope (lower panel) in four groups of subjects. The filled and open bars represent the tone recognition performance listening to the male and female voices respectively.

