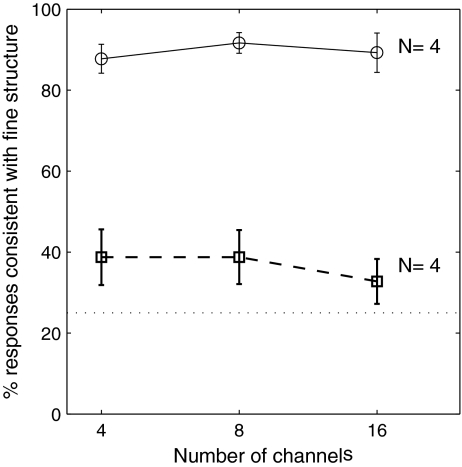
FIG. 5.
Mean percentage of tone response consistent with fine structure obtained with the chimeric tokens (the upper solid line with circles) and that consistent with reconstructed envelope obtained with the tone-vocoded tokens (the lower dashed line with squares) using 4, 8, and 16 channels for four normal-hearing listeners. Chance level corresponded to 25% (the dotted line). Each error bar represents ± 1 SD.

