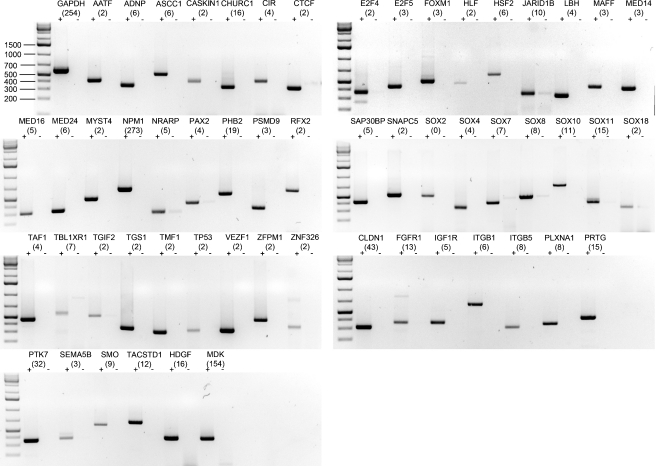
FIG. 4.
Shown are agarose gels stained with ethidium bromide to visualize RT-PCR fragments for genes expressed in the chicken otocyst (indicated with “+”). Control reactions without reverse transcription are labeled with “−”. Faint bands in the “−” control lanes are likely the result of residual genomic DNA contamination. The corresponding gene names are listed in Table 2. Predicted PCR product sizes are listed in ESM Table 1. SAGE tag count numbers are indicated in parentheses.

