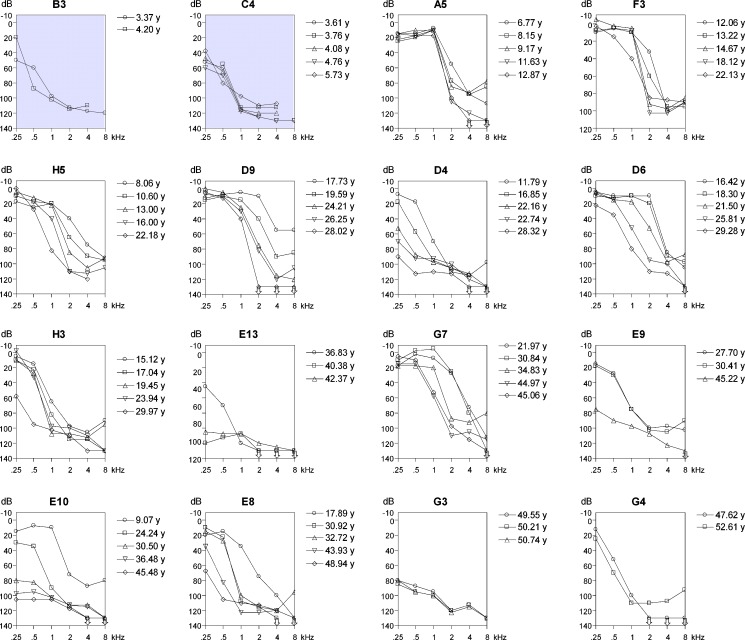
FIG. 2.
Selection of binaural mean air conduction threshold values of clinically affected family members at different ages, ordered by age (from top left to bottom right) at last visit (Cremers et al. 1987). Family number and sequence number are above each audiogram. Gray background, relatively poorer thresholds.

