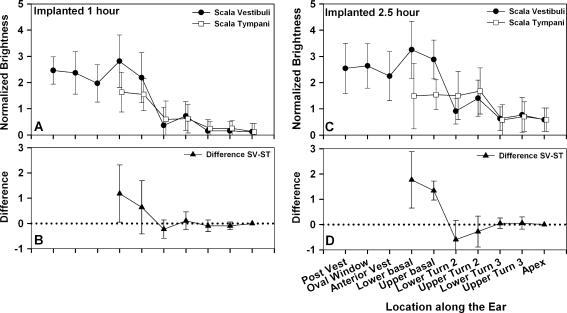
FIG. 4.
Average brightness distribution at 10 defined locations in implanted ears. A 1 h after Gd-DTPA application to RW niche. Closed dots represent SV, and open squares represent ST, N = 9. B Brightness differences between SV and ST after 1 h. C 2.5 h after Gd-DTPA application to RW niche. Closed dots represent SV, and open squares represent ST. N = 9.B Brightness differences between SV and ST after 2.5 h. At this time, both the lower and upper basal turns of SV are significantly brighter than the adjacent regions of ST.

