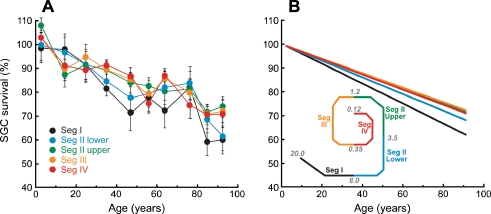
FIG. 4.
The rate of spiral ganglion cell loss with age is similar in all cochlear locations. A Mean spiral ganglion cell counts (±SD) for each decade of age are plotted for each cochlear segment, normalized to the value at birth as described in Figure 3. B Regression lines for the data from each segment. Although the best-fit decline is steeper for the two most basal regions, the differences were not statistically significant. Schematic inset to B shows the relative locations of the five cochlear segments and the approximate cochlear frequency values at the segment boundaries

