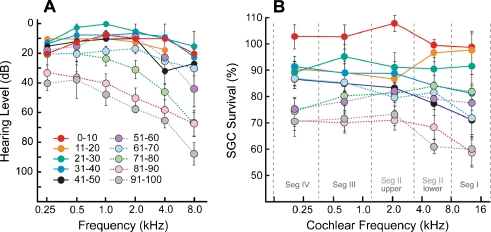
FIG. 5.
Comparison of the age-related decline in audiometric data (A) and in the spiral ganglion cell survival plotted as a function of cochlear location/frequency (B): data shown are means and standard errors. Audiograms were available for only a subset of the ears in the study: 2/12 for 0–10 years; 2/10 for 11–20; 2/10 for 21–30; 4/10 for 31–40; 3/10 for 41–50; 4/10 for 51–60; 3/10 for 61–70; 6/10 for 71–80; 5/10 for 81–90; 2/8 for 91–100. Ganglion cell counts are normalized as described in Figure 3. Cochlear location is converted to frequency according to the map derived by Schuknecht (Merchant 2010).

