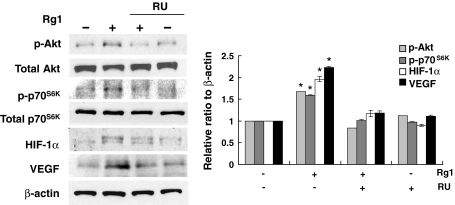
Fig. 5.
Rg1 signals via GR. Cells were pretreated with 10 μM RU486 (RU) before treated with Rg1 (150 nM) for 30 min. Equal amounts of protein (50 μg) were analyzed by immunoblotting using specific antibodies recognizing phospho (p)-Akt and p-p70S6K. The cells were also harvested 1 h after treatment to analyze HIF-1α and VEGF expression. β-actin was included as a loading control. The signal intensities were determined by densitometry and expressed as p-Akt and p-p70S6K relative to total Akt and p70S6K, or HIF-1α and VEGF to β-actin for each sample. Data are shown as mean ± SD of three independent experiments. *P < 0.05, difference with untreated control

