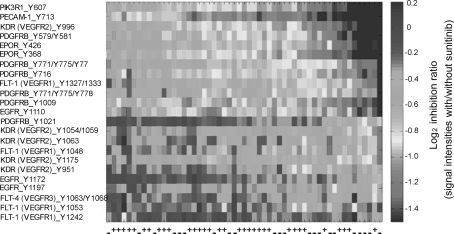
Fig. 3.
Ex vivo sunitinib inhibition profiles from 23 angiogenesis-related kinase substrates. Patient tumor samples along horizontal axis, annotated by negative (−) or positive (+) status for disseminated tumor cells to bone marrow, and phosphosubstrates along vertical axis. Red corresponds to stronger and blue to weaker inhibition of substrate phosphorylation. Left panel Substrate identities. For each substrate, the position of phosphorylation sites within the protein is indicated. (Color figure online)

