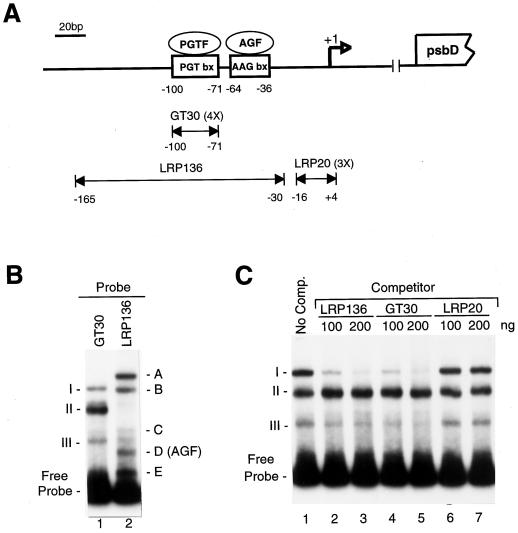
Figure 1.
Schematic representation of the barley chloroplast psbD BLRP. A, The top portion of the figure shows the location of the AAG-box and PGT-box present upstream of the psbD transcription initiation site (marked by an open arrow and designated +1). The psbD open reading frame is shown at the far right. The double-headed arrows represent DNA fragments from the psbD light-responsive promoter used for gel-retardation and competition-binding experiments. GT30 and LRP20 represent four (4X) and three (3X) tandem copies of each region indicated in the figure. B, Gel-shift assays using a GT30 tetramer (lane 1) or the LRP136 DNA fragment (lane 2). All gel-shift assays contained 1 μg of poly (dI–dC)·(dI–dC). Gel-shift complexes A to E and I to III are noted. Band D was previously identified as an AGF, which binds specifically to the AAG-box shown in A. C, Gel-shift assays using the radiolabeled tetramer of GT30 and various amounts (100–200 ng) of unlabeled LRP136, GT30, or LRP20 DNA. The migration of complexes I, II, and III and the free probe is indicated. No Comp., No competitor.

