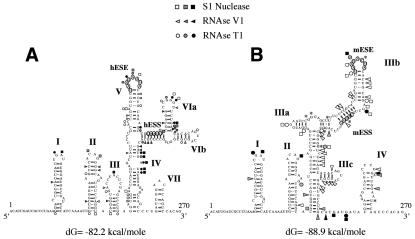
FIG. 4.
Comparison of the RNA secondary structure of the human (A) and mouse (B) wild-type EDA sequences. The two structures were optimized by computer-assisted RNA modeling, and the respective ESE and ESS elements are circled to facilitate their localization. Squares, circles, and triangles indicate S1 nuclease and RNase T1 and V1 cleavage sites, respectively. Black, shaded, and white symbols indicate high, medium, and low cleavage intensities, respectively. The asterisks in the mouse secondary-structure model mark the nucleotide differences between the mouse and human nucleotide sequences.

