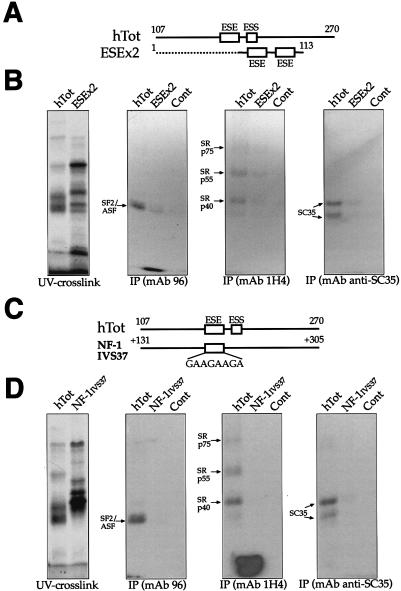
FIG. 9.
IP analysis comparing the recruitment of SR proteins by human ESE sequences alone (GAAGAAGA) as opposed to the full EDA exon. (A) Comparison of the two RNAs used in this experiment: the hTot RNA contains the ESE within its original context (nt 107 to 270), while the ESEx2 RNA contains two copies of the ESE element (flanked only by 8 nt of the EDA sequence) at the 3′ end of pBluescript II SK+ sequences (dotted line). Numbering on the ESEx2 construct refers to the distance from the T3 RNA polymerase promoter on pBluescript II SK+. A control RNA is also included. IPs (B) were performed with equal amounts of the UV cross-linked samples and with the different specific MAbs against SR proteins: SF2/ASF (MAb 96), the phosphorylated RS domain (MAb 1H4), and SC35 (anti-SC35). The leftmost gel contains the total UV cross-linked proteins prior to IP. (C) Comparison of the hTot RNA with a naturally occurring, 170-nt-long intronic region containing a GAAGAAGA sequence from IVS37 of the NF-1 gene. The numbering on the IVS37 construct refers to intronic nucleotide positions starting from the 5′ splice site of NF-1 exon 37. (D) IP profile of these two sequences with the same antibodies used in panel B. As above, the leftmost gel contains the total UV cross-linked proteins prior to IP. In all of the gels, the mobility of the SR proteins is indicated on the left. Samples were run on an SDS-11% PAGE gel and exposed to BioMax autoradiographic film.

