FIG. 5.
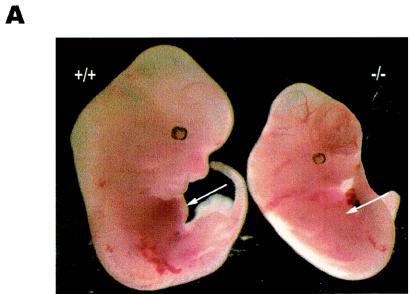
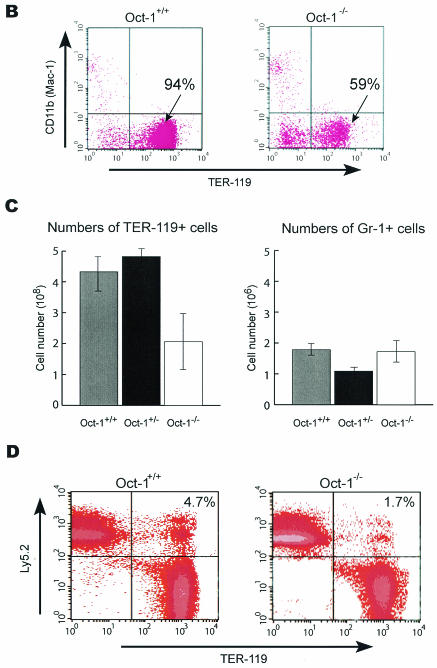
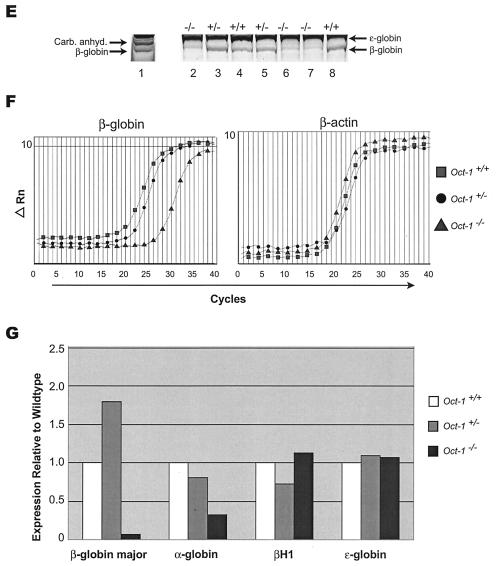
Oct-1-deficient embryos are runted and anemic and show reduced β-globin expression. (A) Comparison of an Oct-1-deficient embryo (right) with a wild-type littermate control (left) at E12.5. Oct-1 mutants appeared smaller with pale fetal livers that are reduced in size (arrows). (B and C) Flow cytometry analysis of TER-119-positive cells from E12.5 fetal livers. Oct-1 mutants exhibit a decreased proportion (B) and fewer total numbers (C) of TER-119-positive cells. Three wild-type and four homozygous Oct-1 mutant animals were used. Error bars denote standard deviations. (D) Fluorescence-activated cell sorting analysis of bone marrow from adoptive transfer of fetal livers. Irradiated recipient animals were injected with fetal liver cells from E12.5 Oct-1−/− embryos. At 16 weeks after transfer, bone marrow cells from the recipient mice were analyzed by staining with antibodies directed against TER-119 and CD45.2/Ly-5.2. (E) Separation of fetal and adult globins by Triton-acetic acid-urea gel electrophoresis of protein extract from E11.5 embryos. Lane 1: peripheral blood control derived from 8-week-old adult mouse; lanes 2 to 8, embryos with their genotypes indicated. Carb. Anhyd., carbonic anhydrase. (F) Real-time PCR amplification curves for β-globin and β-actin. Data are shown for one representative set of experiments. (G) Quantitation of globin RNA levels by SYBR green real-time PCR. RNA was purified from E12.5 TER-119-positive fetal liver cells.


