

Abstract
Objective:
To determine the prevalence of tooth size discrepancy (TSD) in a representative orthodontics population, to explore how many millimeters of TSD is clinically significant and to determine the ability of simple visual inspection to detect such a discrepancy.
Materials and Methods:
The sample comprised 150 pretreatment study casts with fully erupted and complete permanent dentitions from first molar to first molar, which were selected randomly from records of the orthodontic patients. The mesiodistal diameters of the teeth were measured at contact points using digital calipers and the Bolton's analysis was carried out on them. Simple visual estimation of Bolton discrepancy was also performed.
Results:
In the sample group, 24% of the patients had anterior tooth width ratios and 8% had total arch ratios greater than ±2 standard deviation (SD) from Bolton's means. For the anterior analysis, correction greater than ±2 mm was required for 24% of patients in the upper arch or 14% in the lower arch. For the total arch analysis, correction greater than ±2 mm was required for 36% of patients in the upper arch or 32% in the lower arch.
Conclusion:
Bolton's analysis should be routinely performed in all orthodontic patients and the findings should be included in orthodontic treatment planning. 2 mm of the required tooth size correction is an appropriate threshold for clinical significance. Visual estimation of TSD has low sensitivity and specificity. Careful measurement is more frequently required in clinical practice than visual estimation would suggest.
Keywords: Bolton's ratios, tooth size discrepancy, anterior ratio, total arch ratio
Introduction
An excellent orthodontic treatment result with optimal occlusion and ideal intercuspation, overjet and overbite is often jeopardized by tooth size discrepancies (TSDs) or problematic tooth anatomy. A TSD conventionally has been described as a relative excess of tooth structure in one arch in relation to the other arch.[1] It can also be defined as a disproportion among the sizes of individual teeth.[2] There have been several studies suggesting methods of defining and measuring TSD,[3–5] but the best known study of tooth size disharmony in relation to treatment of malocclusion was by Bolton[6] who evaluated 55 cases with excellent occlusions and developed two ratios for estimating TSD by measuring the summed mesiodistal widths of the mandibular to the maxillary anterior teeth (anterior ratio 77.2±1.65%) and the total width of all lower to upper teeth from first molar to first molar (overall or total arch ratio 91.3±1.91%).
One way for clinicians to get a better feel for the clinical significance of a discrepancy is to focus more on the actual size of the discrepancy than on the Bolton's ratios alone. Proffit[2] stated that TSDs less than 1.5 mm are rarely significant. He also suggested that a quick check for anterior TSD can be done by comparing the size of upper and lower lateral incisors. For posterior TSD, he recommends that a quick visual check be done by comparing the size of upper and lower second premolars, which should be of approximately equal size. The prevalence of significant TSD is different for different populations. Many studies have been carried out to determine the prevalence of TSD in various populations.[7–11] This is because orthodontists have realized the importance of this subject. McLaughlin, Trevisi and Bennett[12] have suggested it to be referred to as the seventh key of normal occlusion. However, the prevalence to TSD in Indian orthodontic population remains uncertain.
The aims and objectives of the present study were to investigate the following:
What percentage of a representative North Indian orthodontic population has a TSD?
How much TSD matters clinically in millimeters?
Is simple visual estimation a good method for clinical use?
Materials and Methods
Pretreatment study casts of 150 orthodontic patients reporting to the Department of Orthodontics, PDM Dental College, Bahadurgarh, were used in this study; 81 study casts were of males and 69 were of females and the sample included random selection of malocclusion. All patients were aged between 16 and 26 years.
The following inclusion criteria were used in the selection of the study models:
Good quality study models.
All the permanent teeth were fully erupted and present, from right first permanent molar to the left first permanent molar.
No extraction or interproximal stripping was performed.
No obvious interproximal or occlusal wear of teeth.
The following were the exclusion criteria:
Broken study models.
Gross restorations, build-ups, crowns, onlays, class II amalgams or composite restorations that affect the tooth mesiodistal diameter.
Congenitally missing impacted and grossly carious teeth.
The samples were selected randomly for measurement. Measurement was made directly on the study models by using the electronic digital calipers accurately to 0.01 mm with fine tips to improve the access into the interproximal distance [Figure 1]. The width of each tooth was measured from its mesial contact point to its distal contact point at its greatest interproximal distance from first molar to the first molar with the calipers held perpendicular to the long axis of each tooth. Contact points were defined as the points on the approximate surfaces which should be touching when the teeth were perfectly aligned. Each sample was measured by two operators (RS and SK) and the average value was recorded. Only 8–10 models were measured each day to prevent any effects of fatigue. All the measurements of each tooth from first molar to first molar were then transferred to the data sheets. The overall sum of maxillary and mandibular teeth (6 to 6) and the sum of the anterior maxillary and mandibular teeth (3 to 3) were calculated using Microsoft excel program. The total and anterior ratios were determined by Bolton's formula:
Figure 1.

Calibration of the mesiodistal widths of teeth from study cast

Bolton's ratios were used as guidance in this research (91.3±1.91% for the total ratio and 77.2±1.65% for the anterior ratio, respectively). For comparison with the measurements, simple visual estimation of TSD was also carried out in accordance with Proffit's suggestions.
Assessment of reproducibility
Each investigator (RS and SK) was tested for their intra-examiner reproducibility of the method of measurement. Each of them measured 10 study casts twice which were randomly selected from the main study group with a week between the measurements. The measurements were also selected for inter-examiner reproducibility.
Statistical analysis
After the measurements corresponding to the sum of mesiodistal widths for the 6 maxillary and mandibular anterior teeth and 12 maxillary and mandibular teeth were obtained, their distribution was evaluated and all the data were demonstrated to come from a normally distributed population. Pearson correlation coefficient was used to measure the intra-operator reproducibility and inter-operator reproducibility. Student's paired t-test was used for the assessment of the systematic error (the mean difference between the repeated measurements) and the random error (the standard deviation of the difference). To determine whether there were gender differences in the incidence of the tooth size ratios and discrepancies, an independent-sample t-test was performed. Statistical analyses were carried out using Statistical Package for Social Sciences (SPSS) version 10.0.
Results
Reproducibility
The intra-examiner systematic and random errors for both examiners are detailed in Table 1a (SK) and Table 1b (RS). There was no significant difference found between the two sets of measurements. The correlation coefficient was relatively high for both the examiners. Table 2 contains the analysis of systematic and random errors between two examiners. There was no significant difference found between the two examiners and the correlation coefficient was also relatively high.
Table 1a.
Intra-examiner reproducibility observer SK

Table 1b.
Intra-examiner reproducibility observer RS

Table 2.
Inter-examiner reproducibility observers SK and RS

Gender distribution
Table 3 summarizes the mean for male and female, mean differences and statistical comparisons of the tooth size ratios. It shows that there was no significant sexual dimorphism for any of the parameters; therefore, the sexes were combined for all other analyses.
Table 3.
Descriptive comparison for male and female

Size and distribution of TSD
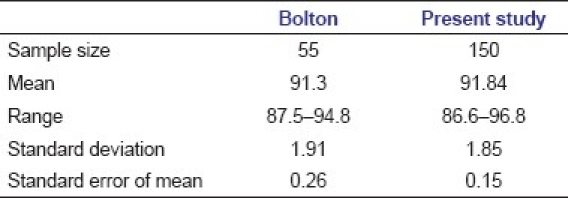
Tables 4a and b compare the sample with Bolton's original samples. The mean ratios for the orthodontic patients of the present study were slightly higher than Bolton's value and had a larger range than his sample of excellent occlusion. Graph 1 shows the distribution of anterior tooth-width ratios in this study categorized by Bolton's original means and standard deviations (SD). 24% of the sample had anterior tooth-width ratios greater than ±2 SD from Bolton's mean (22% greater than +2 SD and 2% less than –2 SD). This shift to the right compared with Bolton's results demonstrates relatively more mandibular tooth width. Graph 2 shows the same data for the overall ratio. For the overall ratio, the percentage falling more than ±2 SDs from Bolton's mean was 8% of the sample (2% greater than +2 SD and 6% less than –2 SD).
Table 4a.
Comparison of Bolton's study[6] and the present study: Anterior ratio

Table 4b.
Comparison of Bolton's study[6] and the present study: Overall ratio
Graph 1.

Anterior Bolton's ratios: The distribution (percentage) of subjects in this study categorized by the standard deviations of Bolton's original study
Graph 2.

Overall Bolton's ratios: The distribution (percentage) of subjects in this study categorized by the standard deviations of Bolton's original study
Graphs 3 and 4 show the percentages of subjects in terms of the upper and lower corrections in millimeters which would be required to give the mean ratio for Bolton's original sample. In these figures, a negative (–) sign on the X axis indicates relative tooth size deficiency and the correction is to be done by increasing the tooth structure, whereas the positive (+) sign indicates relative tooth size excess requiring correction by reducing the tooth structure. For the anterior analysis [Graph 3], 36% of the sample needed upper correction more than ±1.5 mm and 24% needed upper correction more than ±2 mm while the corresponding figures for the lower arch were 32% and 14%, respectively. For anterior arch correction, the white columns (required upper arch correction) are all taller on the negative side of the graph, suggesting maxillary tooth deficiency, and it is vice versa on the positive side, suggesting mandibular tooth excess. This indicates relative tooth size excess in the mandibular arch as a consistent feature. For total arch correction, the white columns (required upper arch correction) are almost similar on the negative and positive sides of the graph than the corresponding black columns (required lower arch correction). For the total arch analysis [Graph 4], 46% of the sample needed upper correction more than ±1.5 mm and 36% needed upper correction more than ±2 mm while the corresponding figures for the lower arch were 46% and 32%, respectively. This indicates for the tooth arch relative TSDs are almost equally distributed amongst the maxillary and mandibular arches.
Graph 3.

Percentages of subjects by upper and lower correction in millimeters for anterior correction
Graph 4.

Percentages of subjects by upper and lower correction in millimeters for total (whole arch) correction
Table 5 summarizes the sensitivity and specificity results of this study. The caliper measurements were taken as the best estimate of the true (“gold standard”) Bolton's ratio. TSD thresholds of 1.5 mm, 2 mm and 3 mm were chosen. The results were very similar for all thresholds. For all discrepancies, there was low sensitivity (17.94% for >1.5 mm, 39.21% for >2 mm and 45.45% for >3 mm) and higher specificity (85.7% for >1.5 mm, 78.29% for >2 mm and 75.8% for >3 mm).
Table 5.
Sensitivity and specificity tests for TSD more than 2 mm and 3 mm, comparing visual judgment (eyeball estimation) with digital calipers measurement

Discussion
The importance of TSDs in orthodontic diagnosis has been widely reported in the literature and accepted by the orthodontic community because the relationship between the upper and lower dentitions is related to orthodontic finishing excellence. The prevalence of TSDs in this sample was high and serves as an indicator of how important it is to perform a thorough diagnosis before orthodontic treatment. In this study, we found that 60% of the total sample presented with anterior TSDs and 36% with overall TSDs, greater than ±1 SD using the Bolton analysis parameter. Originally, Bolton[6] suggested that the ratio greater than ±1 SD from his reported mean values indicated the need for diagnostic consideration. More recently, clinically significant tooth size ratio discrepancy has generally been defined as ±2 SD outside Bolton's published mean ratios.[7–10,11] By using this definition, an anterior ratio below 73.9% or above 80.5% and the total ratio below 87.5% or above 95.1% would be considered clinically significant. The present study found 24% of the sample had anterior TSDs greater than ±2 SD from Bolton's mean, which coincided with many others,[7,8,9,10,11] as demonstrated in Table 6. It is also clear from Table 6 that all studies have found a lower percentage of cases falling outside Bolton's SD for the overall ratios than for the anterior ratios. Graphs 1 and 2 show that for the anterior discrepancy there was a greater mandibular excess than that of maxillary teeth, whereas the overall discrepancy was almost equally divided amongst maxillary or mandibular excess. The finding for the anterior ratio is similar to those reported by Freeman et al.[8] They stated that the overall discrepancy was equally likely to be an excess in the maxilla or the mandible, whereas the anterior discrepancy was nearly twice more likely to be a mandibular excess than a maxillary excess.
Table 6.
Summary of studies of the prevalence of tooth size discrepancy, defined in terms of Bolton's original standard deviations

Discrepancy in millimeters as a measure of clinical significance
In clinical practice, any correction for TSD may be based on the ratio in percentage terms, but is carried out in absolute millimeters of change in tooth widths. Proffit[2] stated that TSDs less than 1.5 mm are rarely significant. However, considering that recently values falling outside ±2 SD are considered clinically significant, we observed the millimeter values corresponding to ±2 SD and found all the values to be greater than 2 mm. Therefore, 2 mm is considered a clinically significant discrepancy when considering Bolton's measurements in millimeters. Othman and Harradine[11] have also considered a 2-mm threshold as clinically significant, stating that a value of 1.5 mm is only an occlusal discrepancy of 0.75 mm per side and this may be considered too small a potential occlusal error to be clinically significant. Hence, taking this level as a significant discrepancy, the current study revealed [Graphs 3 and 4] that for the anterior arch ratio, 24% of patients required correction through upper arch adjustment or 14% if the lower arch is adjusted, and for the total arch ratio, the corresponding figures are 36% and 32%, requiring correction through upper and lower arch adjustment.
Observing Graphs 3 and 4 which demonstrate the TSD in millimeters, it is clear that the black columns showing mandibular correction are all taller on the positive side, showing mandibular excess in majority of the anterior TSD cases, whereas for overall TSD, both the white and black columns are almost equal in height and distribution on the positive and negative sides. This implies that the discrepancy is equally distributed amongst both the arches in overall TSD cases.
Visual estimation of tooth size discrepancy
Table 5 reveals that simple “eyeballing” of study models is a poor method of assessing TSD in a representative sample of orthodontic patients. Simple visual judgment missed more than half of the subjects with a significant discrepancy. Better specificity was observed, but approximately 20–25% of those estimated not to have a discrepancy did have a significant discrepancy. It can be concluded that the ability of visual judgment to detect a lack of Bolton discrepancy is higher than the ability to detect a significant Bolton discrepancy, but that this method is highly unreliable.
The findings from the present study suggest that a large number of orthodontic patients in our population possess a Bolton TSD. These will influence treatment goals and results as many of these patients are undergoing or going to have orthodontic treatment or had already undergone orthodontic treatment. Bolton tooth size analysis should be used for every orthodontic patient before initiation of treatment. Identifying such a discrepancy before final tooth alignment would prove beneficial in both treatment planning and final expectations of both the clinician and the patient.
Conclusions
24% of the sample had anterior and 8% had overall ratios greater than ±2 SD from Bolton's mean. It would seem prudent to routinely perform the tooth size analysis and include the finding into orthodontic treatment planning.
TSDs are better expressed in terms of the millimeters required for correction. A threshold of 2 mm is recommended.
Simple visual inspection is a poor method of detecting TSD. Careful and more frequent measurements are required in clinical practice.
Footnotes
Source of Support: Nil
Conflict of Interest: None declared.
References
- 1.Fields HW., Jr Orthodontic restorative treatment for relative mandibular anterior excess tooth-Size problems. Am J Orthod. 1981;79:176–83. doi: 10.1016/0002-9416(81)90315-8. [DOI] [PubMed] [Google Scholar]
- 2.Proffit WR. Contemporary orthodontics. 3rd ed. St. Louis: Mosby; 2000. p. 170. [Google Scholar]
- 3.Ballard ML. Asymmetry in tooth sizes a factor in the etiology, diagnosis and treatment of malocclusion. Angle Orthod. 1944;14:67–71. [Google Scholar]
- 4.Neff CW. Tailored occlusion with the anterior coefficient. Am J Orthod. 1949;35:309–14. doi: 10.1016/0002-9416(49)90045-7. [DOI] [PubMed] [Google Scholar]
- 5.Steadman SR. The relationship of upper anterior teeth to lower anterior teeth as present on plaster models of a group of acceptable occlusion. Angle Orthod. 1952;22:91–7. [Google Scholar]
- 6.Bolton WA. Disharmony in tooth size and its relation to the analysis and treatment of malocclusion. Angle Orthod. 1958;28:113–30. [Google Scholar]
- 7.Crosby DR, Alexander CG. The occurrence of tooth size discrepancies among different malocclusion groups. Am J Orthod Dentofacial Orthop. 1989;95:457–61. doi: 10.1016/0889-5406(89)90408-3. [DOI] [PubMed] [Google Scholar]
- 8.Freeman JE, Maskeroni AJ, Lorton L. Frequency of Bolton tooth size discrepancies among orthodontic patients. Am J Orthod Dentofacial Orthop. 1996;110:24–7. doi: 10.1016/s0889-5406(96)70083-5. [DOI] [PubMed] [Google Scholar]
- 9.Santoro M, Ayoub ME, Pardi VA, Cangialosi TJ. Mesiodistal crown dimensions and tooth size discrepancy of the permanent dentition of Dominican Americans. Angle Orthod. 2000;70:303–7. doi: 10.1043/0003-3219(2000)070<0303:MCDATS>2.0.CO;2. [DOI] [PubMed] [Google Scholar]
- 10.Bernab E, Major PW, Flores-Mir C. Tooth-width ratio discrepancies in a sample of Peruvian adolescents. Am J Orthod Dentofacial Orthop. 2004;125:361–5. doi: 10.1016/j.ajodo.2003.04.008. [DOI] [PubMed] [Google Scholar]
- 11.Othman SA, Harradine NW. Tooth size discrepancies in an orthodontic population. Angle Orthod. 2007;77:668–74. doi: 10.2319/031406-102. [DOI] [PubMed] [Google Scholar]
- 12.McLaughlin R, Bennett J, Trevisi H. 2nd ed. St Louis, MO: Mosby; 2007. Systemized orthodontic treatment mechanics; p. 285. [Google Scholar]