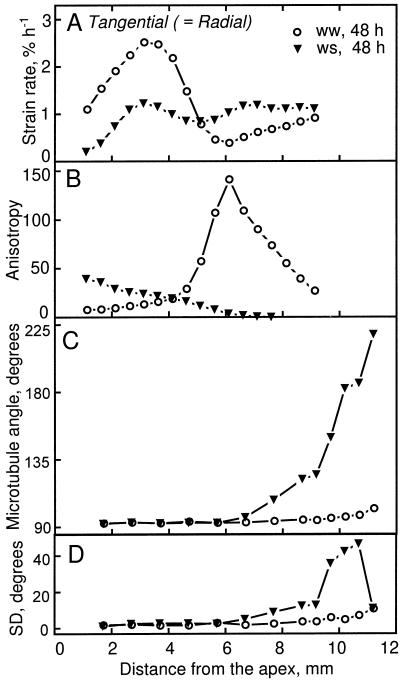
Figure 4.
Tangential (radial) strain rate, growth anisotropy, and microtubule orientation as a function of distance from the apex for the stele of well-watered (ww) and water-stressed (ws) roots. A, Tangential strain rate. B, Growth anisotropy, calculated as the ratio of longitudinal to tangential strain rates. Note that the longitudinal strain rate profile shown in Figure 1A is the same for all tissues. C, Mean microtubule angle measured is stelar parenchyma. D, The sds of the above distributions. Data in A and B are from Liang et al. (1997) and in C and D are averages of at least 100 microtubules measured per position from 5 to 10 roots.

