
Fig. 7.
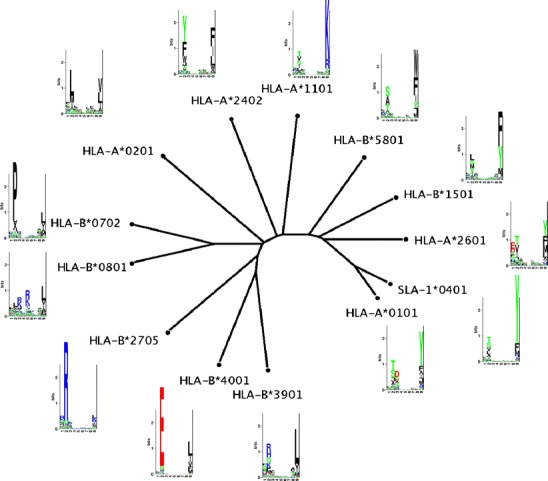
Specificity tree clustering of the SLA-1*0401 molecule compared to prevalent representatives of the 12 common HLA supertypes (Lund et al. 2004). The distance between any two MHC molecules and the consensus tree is calculated as described in “Materials and methods”. All branch points in the tree have bootstrap values of 100%. Sequence logos of the predicted binding specificity are shown for each molecule. In the logo, acidic amino acids [DE] are shown in red, basic amino acids [HKR] in blue, hydrophobic amino acids [ACFILMPVW] in black, and neutral amino acids [GNQSTY] in green. The axis of the LOGOs indicates in all case positions one through nine of the motif, and the y-axis the information content (see Materials and methods)