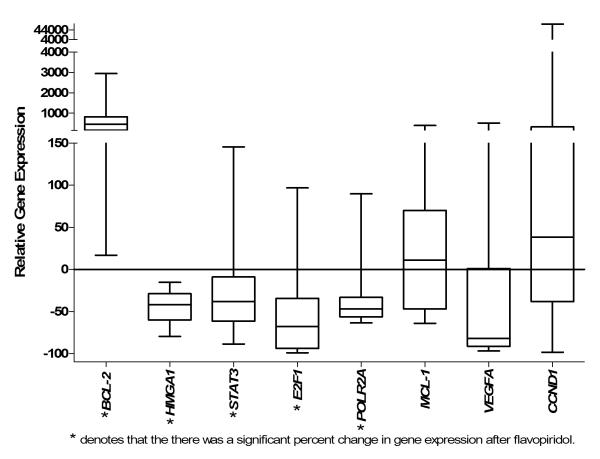
Figure 2. Average percent change in gene expression following therapy with flavopiridol.
The relative change in gene expression for all patients was calculated as the difference of the pre-treatment level and post-treatment level divided by the pre-treatment level and multiplied by 100 as follows: Δ mRNA level pre-flavopiridol – mRNA levels post flavopiridol/pre mRNA level pre-flavopiridol*100. The relative gene expression is reported as Box and Whisker Plots n=16 (in triplicate). The minimum and maximum values are shown as the top and bottom values of each whisker, and the median is shown as the center line of each box.

