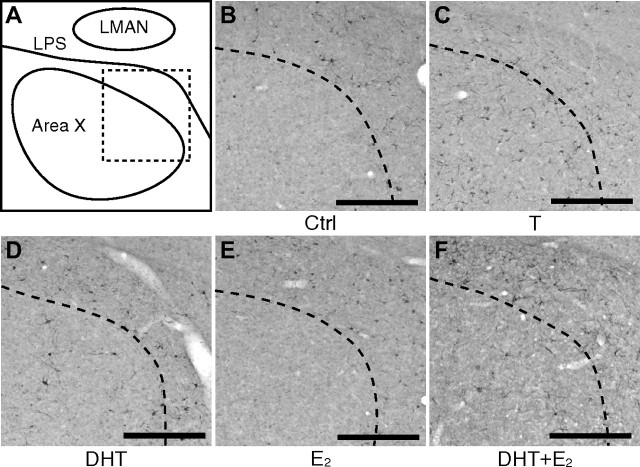
Figure 6.
Photomicrographs of DCX-ir cells in area X illustrating the changes in density of these cells in female canaries treated with various steroid hormones. A, Simplified schematic drawing of a coronal section at the level of area X in the medial striatum indicating the areas illustrated in the photomicrographs (dotted square). B–F, Photomicrographs of DCX-ir cells in area X for each steroid hormone treatment. The dotted lines in B–F indicate the dorsolateral boundary of area X. Note the much lower density of DCX-ir cells in area X than in HVC. LPS, Lamina palliosubpallialis. Scale bar, 250 μm.

