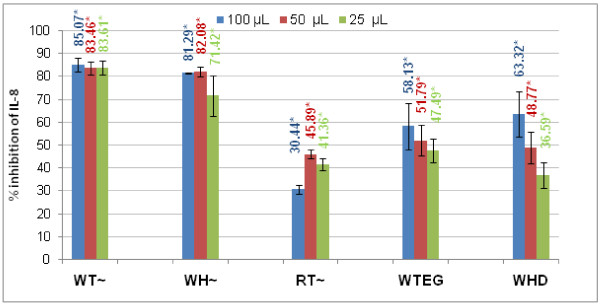
Figure 1.
Inhibition of IL-8 release by the WT, RT, WH, WTEG and WHW. Comparisons are against control values for (N = 6 ± SEM, *P < 0.05 compared with H2O2 control). Exact % values are given for clarity. Extracts (~) were tested at 100, 50 and 25 μg final volume, WTEG was tested at 6.25, 3.125 and 1.256% and WHD at 25, 12.5, and 6.25% respectively. Legend indicates volume added in assay to yield afore-mentioned concentrations.

